NAME ______________________________ DATE _______________
![]() FAMILY LETTER
FAMILY LETTER
(PAGE 2 OF 2)
About the Mathematics in This Unit
| Benchmarks | Examples |
|---|---|
| Determine what values are represented by points on a coordinate grid. |

Point B represents the value 3 on the x-axis and 5 on the y-axis. |
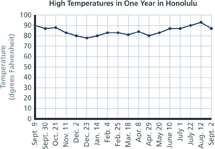
| Represent real world and mathematical problems by graphing points in the coordinate plane and interpret the graph in the context of the situation. |
On September 9, the temperature was 90°F. |
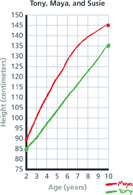
| Use tables and graphs to compare two situations governed by rules that generate numerical patterns. |
 d
d
|
Please look for more information and activities about Temperature, Height, and Growth that will be sent home in the coming weeks.
Table of Contents
Investigations 3 in Number, Data, and Space®, Student Activity Book
Unit 1 Puzzles, Clusters, and Towers
Investigation 1
Investigation 2
Investigation 3
Unit 2 Prisms and Solids
- Number Puzzles: 1 Clue
- Factors and Multiples
- Seeing Number Dot Patterns
- About the Mathematics in This Unit
- Number Puzzles: 2 Clues
- Factors of 2-Digit Numbers
- Number Puzzles Recording Sheet
- Number Puzzles
- Multiplication Facts
- Multiplication Facts Recording Sheet
- Homework
- Practicing Multiplication Facts
- Order of Operations
- Factors of 3-Digit Numbers
- Multiplication Facts 2
- Related Activities to Try at Home
- Practicing the Order of Operations
- Multiplication Facts 3
- Multiplying 2-Digit Numbers
- Multiplication Facts 4
- Solving Multiplication Problems
- Multiplying Two Ways
- Multiplication Practice
- More Multiplying Two Ways
- Which Is Greater?
- Multiplication Cluster Problems
- Problems Involving Teams
- More Multiplying 2-Digit Numbers
- Multiplication Facts 5
- More Multiplication Cluster Problems
- Using the Order of Operations
- Starter Problems
- Multiplication Clusters
- Multiplying 2-Digit Numbers
- More Starter Problems
- More Problems Involving Teams
- How Do I Start?
- Dividing by 2-Digit Numbers
- Solve in Two Ways
- Problems about Multiples of 21
- Sharing School Supplies
- Solving 315 ÷ 21
- Division Problems
- Making Teams
- Numbers Off the Tower
- Understanding the Order of Operations
- Multiple Tower for 15
- Division Cluster Problems
- Division
- Division Practice
- Problems about Division Compare
- Solving Division Problems
- Applying the Order of Operations
- Practicing Multiplication and Division
- Multiple Towers and Filmmaking
Investigation 1
Investigation 2
Unit 3 Rectangles, Clocks, and Tracks
- How Many Cubes?
- A Strategy for Finding Volume
- Will They Fit?
- Multiplication Practice
- About the Mathematics in This Unit
- Volume of Boxes
- What Should We Do with the Extras?
- More Boxes
- Related Activities to Try at Home
- Doubling the Number of Cubes
- Multiplication Practice: Solve Two Ways
- The Symphony
- How Many Packages in Box 1?
- Division Practice
- Multiplication Starter Problems
- Volume of Rectangular Prisms
- Doubling and Halving
- Solving Division Problems
- Volume of Solids
- How Many Packages in Box 2?
- Finding Volume
- Multiplication Clusters
- Double the Number of Cubes
- Design a Box
- Multiplication Starter Problems
- Solving More Division Problems
- Volume Problems
- Number Puzzles
Investigation 1
Investigation 2
Investigation 3
Unit 4 How Many People and Teams?
- What Do You Already Know?
- Practicing Multiplication and Division Problems
- Story Problems: The School Library
- About the Mathematics in This Unit
- Representing Fractions
- Equivalent Fractions
- Solving Division Problems
- What Fractions Do You See?
- Related Activities to Try at Home
- Finding Equivalent Fractions
- Which Is Greater?
- Representing More Fractions
- Comparing 23 2 thirds and 34 3 fourths
- Fraction Problems
- In Between Problems
- Comparing 78 7 eighths and 56 5 sixths
- Ordering Fractions
- More In Between Problems
- Clock Fractions
- Clock Fractions Addition Problems
- Comparing Fractions
- Problems about Volume
- Roll Around the Clock Problems
- Volume of Rectangular Prisms
- Using Rectangles to Add Fractions
- Adding Fractions
- Which is Closer to 1? Part 1
- Practice Adding Fractions
- Fractions That Add Up to One
- Which is Closer to 1? Part 2
- More Roll Around the Clock Problems
- Equivalents
- Finding Volume
- Subtracting Fractions
- Taking a Hike
- Volumes of Rectangular Solids
- Adding and Subtracting Fractions
- Order of Operations Practice
- Moves on the Fraction Track
- Using the Order of Operations to Solve Problems
- More Moves on the Fraction Track
- Addition and Subtraction Problems with Fractions
- Finding Common Denominators
- Solving Multiplication Story Problems
- Grasshopper Lengths
- Addition Compare
- Grasshopper Collections
- Adding and Subtracting Mixed Numbers
- Comparing Sums and Differences 1
- Practicing Division
- Comparing Sums and Differences 2
- Problems about Apples
Investigation 1
Investigation 2
Investigation 3
Unit 5 Temperature, Height, and Growth
- Multiplication: How Did I Solve It?
- Adding and Subtracting Fractions and Mixed Numbers
- Multiplication Two Ways
- About the Mathematics in This Unit
- Multiplication Problems
- Finding Products
- Solving 45 × 36
- Related Activities to Try at Home
- Two Algorithms: What Do They Mean?
- Applying the U.S. Standard Algorithm for Multiplication
- Finding Products 2
- Teams
- Practicing the U.S. Standard Algorithm
- Solving Multiplication Problems
- Using the U.S. Standard Algorithm for Multiplication
- Add and Subtract Fractions
- Multiplying Numbers
- Order of Operations Practice
- Multiplication and Division Practice
- Division Practice
- Sharing Equally
- Dividing by Multiples of 10
- Counting Around the Room
- Dividing 500 by 16
- Classroom Counting Puzzles
- Division Starter Problems
- Classroom Supplies
- Finish It Up!
- Counting Puzzles
- Solving Division Problems
- Different First Steps
- Adding and Subtracting Mixed Numbers Practice
- Division: How Did I Solve It?
- Making Estimates
- Division Practice
- Division Two Ways
- Field Day Refreshments
- Large and Small Hunt
- Multiplication and Division Practice
- Field Day Lunch and Cleanup
- Field Day Activities: Relay Race
- Field Day Activities: Kickball
- Field Day Activities: Tug of War
- Two-Part Problems
- Multiplying and Dividing Multiples of 10
- Field Day Problems
- Multiplying and Dividing Large Numbers
- Multiplication and Division with Large Numbers
- Juice and Oranges
- Multiplication and Division Two Ways
- Milk Cartons
- Supersonic Flight
Investigation 1
Investigation 2
Unit 6 Between 0 and 1
- Temperatures in Two Cities
- Solve Two Ways
- Division Practice
- About the Mathematics in This Unit
- High Temperatures in One Year in Honolulu
- High Temperatures in One Year in U.S. Cities
- Temperatures for a Day in June: Anchorage, Alaska
- Temperatures for a Day in June: El Paso, Texas
- Related Activities to Try at Home
- Growth Stories: Tara and Nat
- Division Starter Problems
- Teams
- Representing Growth Stories: Tony, Maya, and Susie
- Multiplication Practice
- Flickerbill's Growth
- Writing Numbers in Expanded Form
- Division Problems
- The Krink, the Trifoot, and the Water Weasel
- Powers of 10 Practice
- Fastwalker
- Spiraltail's and Inksnake's Growth Table
- School Supplies
- 3 Squares Across: Area
- 3 Squares Across: Perimeter
- School Carnival Problems
- Counting Puzzles
- Multiplication and Division Practice
- _______________ Squares Across: Area
- _______________ Squares Across: Perimeter
- _______________ Squares Across: Perimeter
- On Sale!
- Multiplying and Dividing Larger Numbers
- 10 Squares Across: Area
- 10 Squares Across: Perimeter
- Ordered pairs
- Field Day Prizes
- Growing Squares
- Graphing Ordered pairs
- Admission Price
- Staircase Towers: Jumps of 1
- Staircase Towers: Jumps of 2
- Practicing the U.S. Standard Algorithm for Multiplication
- Solving Division Problems
- Helping Hands
Investigation 1
Investigation 2
Unit 7 Races, Arrays, and Grids
- Tenths and Hundredths
- How Much of the Garden Is Planted?
- How Much Is Shaded?
- Solving Division Problems
- About the Mathematics in This Unit
- Hundredths and Thousandths
- Decimals on Hundredths and Thousandths Grids
- Matching Shaded Portions
- Comparing Decimals
- Solving Multiplication and Division Problems
- More Comparing Decimals
- Decimal Grids
- Ordering Decimals
- Solve Two Ways
- Ordering Precipitation Amounts
- Related Activities to Try at Home
- Which Is Greater?
- More Precipitation
- Rounding Decimals
- Practice with Rounding
- Decimal Problems
- Rounding Practice
- Swim Meet: 200-Meter Butterfly
- Smaller to Larger
- Birds and Bugs
- Collections
- Precipitation in the Desert
- The Jeweler's Gold
- Closest Estimate
- Decimals In Between Problems
- Adding Decimals
- Mystery Tower
- Subtraction Problems with Decimals
- Decimal Subtraction Problems
- Fill Two Problems
- Decimal Problems
- Gymnastics: Women's All-Around Scores
- What's the Difference?
- More Decimal Problems
- Gymnastics: Men's All-Around Scores
- Adding and Subtracting Decimals
- Close to 1
- Adding and Subtracting Precipitation Amounts
- Decimals in Expanded Form
- Understanding Place Value
- Solving Decimal Problems
Investigation 1
Investigation 2
Investigation 3
Unit 8 Properties of Polygons
- Running and Biking Distances
- Adding and Subtracting Decimals
- Multiplying Fractions by Whole Numbers
- About the Mathematics in This Unit
- Big Bicycle Race
- Comparing Batting Averages
- Take a Hike
- Bicycle Race Training
- Ordering Decimals
- Another Bicycle Race
- Related Activities to Try at Home
- Cycling and Running
- Squeeze Between
- Training for a Race
- Fractions of Fractions
- Fraction Match
- Canoe Trip
- Multiplying Fractions
- Measuring Distance
- More Multiplying Fractions
- Using Arrays to Multiply Fractions
- Planting Vegetables
- Hiking Trails
- Multiplying Fractions and Mixed Numbers Practice
- Practicing Multiplication of Fractions
- Dividing a Whole Number by a Fraction
- Writing Numbers in Expanded Form
- Making Bows
- Dividing a Fraction by a Whole Number
- Biking to the Park
- Dividing It All Up
- Dividing with Fractions
- Multiplying Fractions Problems
- Popcorn Problems
- Multiplying by Powers of 10
- Money and Powers of 10
- Adding and Subtracting with Decimals
- Multiplying Decimals
- Reasoning about Decimals
- Powers of 10 and Multiplication
- Buying School Supplies
- A Strategy for Multiplying Decimals
- Decimal Multiplication
- Adding and Subtracting Decimals Practice
- Animal Speeds
- How Far?
- Multiplication with Decimals
- Animal Speeds and Jumps
- Decimal Multiplication Problems
- Dividing by Powers of 10
- Hana's Money
- Miles and Miles
- Dividing Decimals
- Division Problems with Decimals
- Solving Decimal Problems
- Converting Length, Mass, and Capacity (Metric)
- Decimal Division Problems
- Metric Measurement Conversions
- Converting Length and Weight (U.S.)
- Rhomaar Animal Jumps
- U.S. Measurement Conversions
- More Dividing with Decimals
- Converting Capacity (U.S.)
- Converting Measurements
- Jumping Animals
- Equivalent Lengths
- Metric and U.S. Measurement Conversions
Investigation 1
Investigation 2
- Triangles: Two the Same, One Different
- Long and Tall
- Which Triangle Doesn't Belong?
- About the Mathematics in This Unit
- Quadrilaterals: Two the Same, One Different
- Types of Quadrilaterals
- Which Quadrilateral Doesn't Belong?
- Related Activities to Try at Home
- Some Figures Have Many Names
- Finding Equivalent Measures
- Squares and Rectangles
- Representation of Relationships among Quadrilaterals
- Categories of Triangles
- Fraction Bar Multiplication
- Parallel or Not?
- Quadrilateral Categories
- Follow the Rules
- Building a Sequence of Squares
- Converting U.S. Measurements of Length
- What's Cooking?
- Doubling Squares
- Category Search
- Decimal Division
- A Sequence of Rectangles
- Converting U.S. Measurements of Capacity
- Growing Rectangles
- Rearranging a 16 × 12 Rectangle
- Fencing a Garden
- Another Growing Rectangle
- Animal Robots
- Fraction Multiplication with Arrays


